How did the federal hiring freeze impact jobs? The raw numbers don't tell the whole story.
When you look at individual agencies, the story becomes much more interesting.
No one was surprised when President Trump imposed a hiring freeze. Across many government agencies, the broad freeze brought hiring to a screeching halt. As the freeze was lifted, and agency heads were given more authority to decide when and whether to fill jobs, most observers of government expected hiring to get back to normal. After all, most hiring freezes have been little more than political theater. Typically, they are intended to address a short-term money crunch or to send a message to that the government is being reined in.
So--was this one political theater? Did it actually make a difference in the number of people on the government payroll? Or is everything back to normal when it comes to hiring in the federal sector? The most current publicly available data comes from Fedscope, an excellent site run by the United States Office of Personnel Management (OPM). Fedscope provides historical data and current employment numbers through the end of September 2017. If we look at raw numbers, the federal workforce has dropped from 2,093,868 employees at the end of December 2016 to 2,087,747 by September 2017, which breaks down to loss of 6,121 (0.29%) employees — not a huge impact for a two-million-person workforce.
But this is one of those cases in which the raw numbers can be misleading.
The top-line numbers include both permanent and temporary employees. During spring and summer, we typically see large increases in the number of temporary workers as a result of seasonal work. When we take the temporary jobs out of the mix and look only at the permanent workforce, we see a different picture.
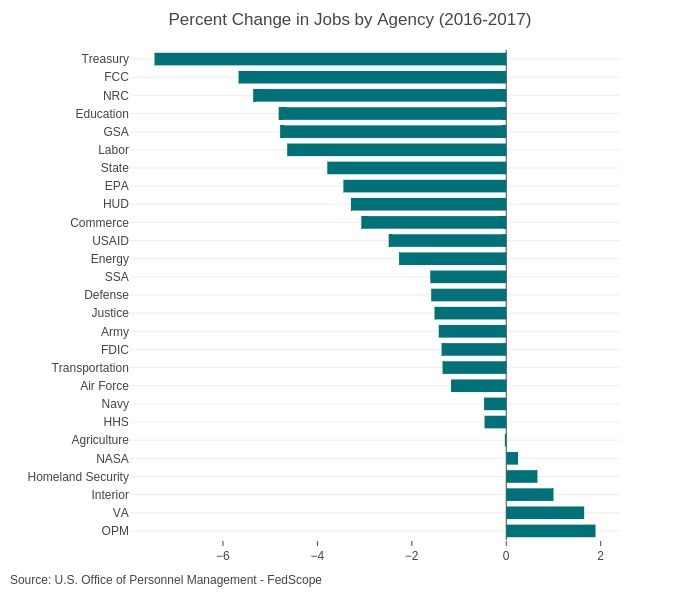
The permanent workforce of 1,962,965 dropped by 15,917 to 1,947,048. That is a decrease of 0.81 percent--still not a huge drop, but significant. The picture changes even more when we stop looking at the total government numbers and start considering shifts on an agency-by-agency level, where we see some numbers that are predictable and some that are surprising. Here is a look at permanent employee numbers for the cabinet and large agencies:
Now the numbers get even more interesting. We see that five agencies are actually growing a bit. OPM, with a mix of appropriated and revolving fund dollars, added employees. Their budget documents show that IT modernization is a big priority (for obvious reasons). The Department of Veterans Affairs is growing to meet the increased demands for veteran benefits and health matters. The Department of Homeland Security is growing because of the increased emphasis on border security.
Most agencies are within a percent or two of last year. The biggest surprise was that the Department of Defense’s drop in permanent civilian employees, extending across the military departments and the defense agencies. Department of Commerce, the Department of Housing and Development, Environmental Protection Agency, and Department of State saw significant cuts. The Department of Labor, General Services Administration, and others saw reductions of four percent or more. The Department of the Treasury came in with a reduction of 7.45 percent, the largest of any cabinet level or large agency. Within the Treasury, the Internal Revenue Service experienced a net loss of 6,801 permanent workers, or a whopping 8.6 percent of its permanent workforce. The IRS now has about 17,000 fewer employees than it had at the end of the George W. Bush administration in 2008, and the precipitous drop has solicited its fair share of concern. As he transitioned out of his role as IRS Commissioner earlier this month, John Koskinen warned against cuts this severe: “If you think you can run this agency with 20,000 fewer people with 10 million more taxpayers and all the responsibilities we have, you live in a different world than I do.”
The top-line numbers obscure the fact that the combination of the hiring freeze, budget pressure, and restructuring are having a significant impact on some agencies. Those we might expect to grow, like Defense, are actually shrinking.
Although we typically think Congress drives employment numbers through the budget, the truth is that agencies actually have a lot of control over how they spend money. Most appropriations do not put a statutorily mandated floor on the number of employees. If an agency or an administration as a whole wants to reduce the size of the federal workforce, it can. The Impoundment Control Act puts some restrictions on an administration's ability to impound appropriated dollars. Enforcement of the act would require an agency to spend money – but not necessarily on federal employees. As we have already seen, the executive branch has broad authority to act on its own.
The best approach to managing the size of the federal workforce is for Congress to pass a timely budget every year, and specify the range of employees an agency would be expected to maintain. We have not seen passage of a timely budget and appropriations bills since the last millennium, so I am not optimistic that we will see that happen any time soon.
Over the next few weeks, we’re taking a look back at the big developments in the federal hiring and human resources space in 2017. Stay tuned for more analysis of the past year and insights into what 2018 may hold for the industry. What’s your take on the impact of the hiring freeze? Tell us what you think on Facebook, Twitter, or LinkedIn.
Which Federal Agencies Saw the Greatest Job Losses and Gains in 2017?
|
Agency |
2017 |
2016 |
Change |
Percent Change |
|---|---|---|---|---|
| Office of Personnel Management | 5,386 | 5,286 | +100 | 1.89% |
| Department of Veterans Affairs | 36,2752 | 35,6852 | +5,900 | 1.65% |
| Department of the Interior | 54,533 | 53,995 | +538 | 1% |
| Department of Homeland Security | 18,2591 |
18,1401 | +1,190 | 0.66% |
| National Aeronautics and Space Administration | 17,109 | 17,066 | -43 | -0.25% |
| Agriculture | 77,897 | 77,919 | -22 | -0.03% |
| Department of Health and Human Services | 66,699 | 67,007 |
-380 | -0.46% |
| Navy | 203,141 | 204,095 | -954 | -0.47% |
| Air Force | 158,352 | 160,228 | -1,876 | -1.17% |
| Department of Transportation | 53,847 | 54,585 | -738 | -1.35% |
| Federal Deposit Insurance Corporation | 5,615 | 5,693 | -78 | -1.37% |
| Army | 230,821 | 234,159 | -3,338 | -1.43% |
| Department of Justice | 112,361 | 114,098 | -1,737 | -1.52% |
| Department of Defense | 101,894 | 103,537 | -1,643 | -1.59% |
| Social Security Administration | 61,737 | 62,749 | -1,012 | -1.61% |
| Department of Energy | 14,373 | 14,707 | -334 | -2.27% |
| U.S. Agency for International Development | 3,018 | 3,095 | -77 | -2.49% |
| Department of Commerce | 42,906 | 44,263 | -1,357 | -3.07% |
| Department of Housing and Urban Development | 7,721 | 7,984 | -263 | -3.29% |
| Environmental Protection Agency | 14,237 | 14,745 | -508 | -3.45% |
| Department of State | 10,280 | 10,685 | -405 | -3.79% |
| Department of Labor | 14,830 | 15,551 | -721 | -4.64% |
| General Services Administration | 11,180 | 11,742 | -562 | -4.79% |
| Department of Education | 3,890 | 4,087 | -197 | -4.82% |
| Nuclear Regulatory Commission | 3,127 | 3,304 | -177 | -5.36% |
| Federal Communications Commission | 1,447 | 1,534 | -87 | -5.67% |
| Department of the Treasury | 86,797 | 93,786 | -6,989 | -7.45% |